Extracting OSM data for SVG use.
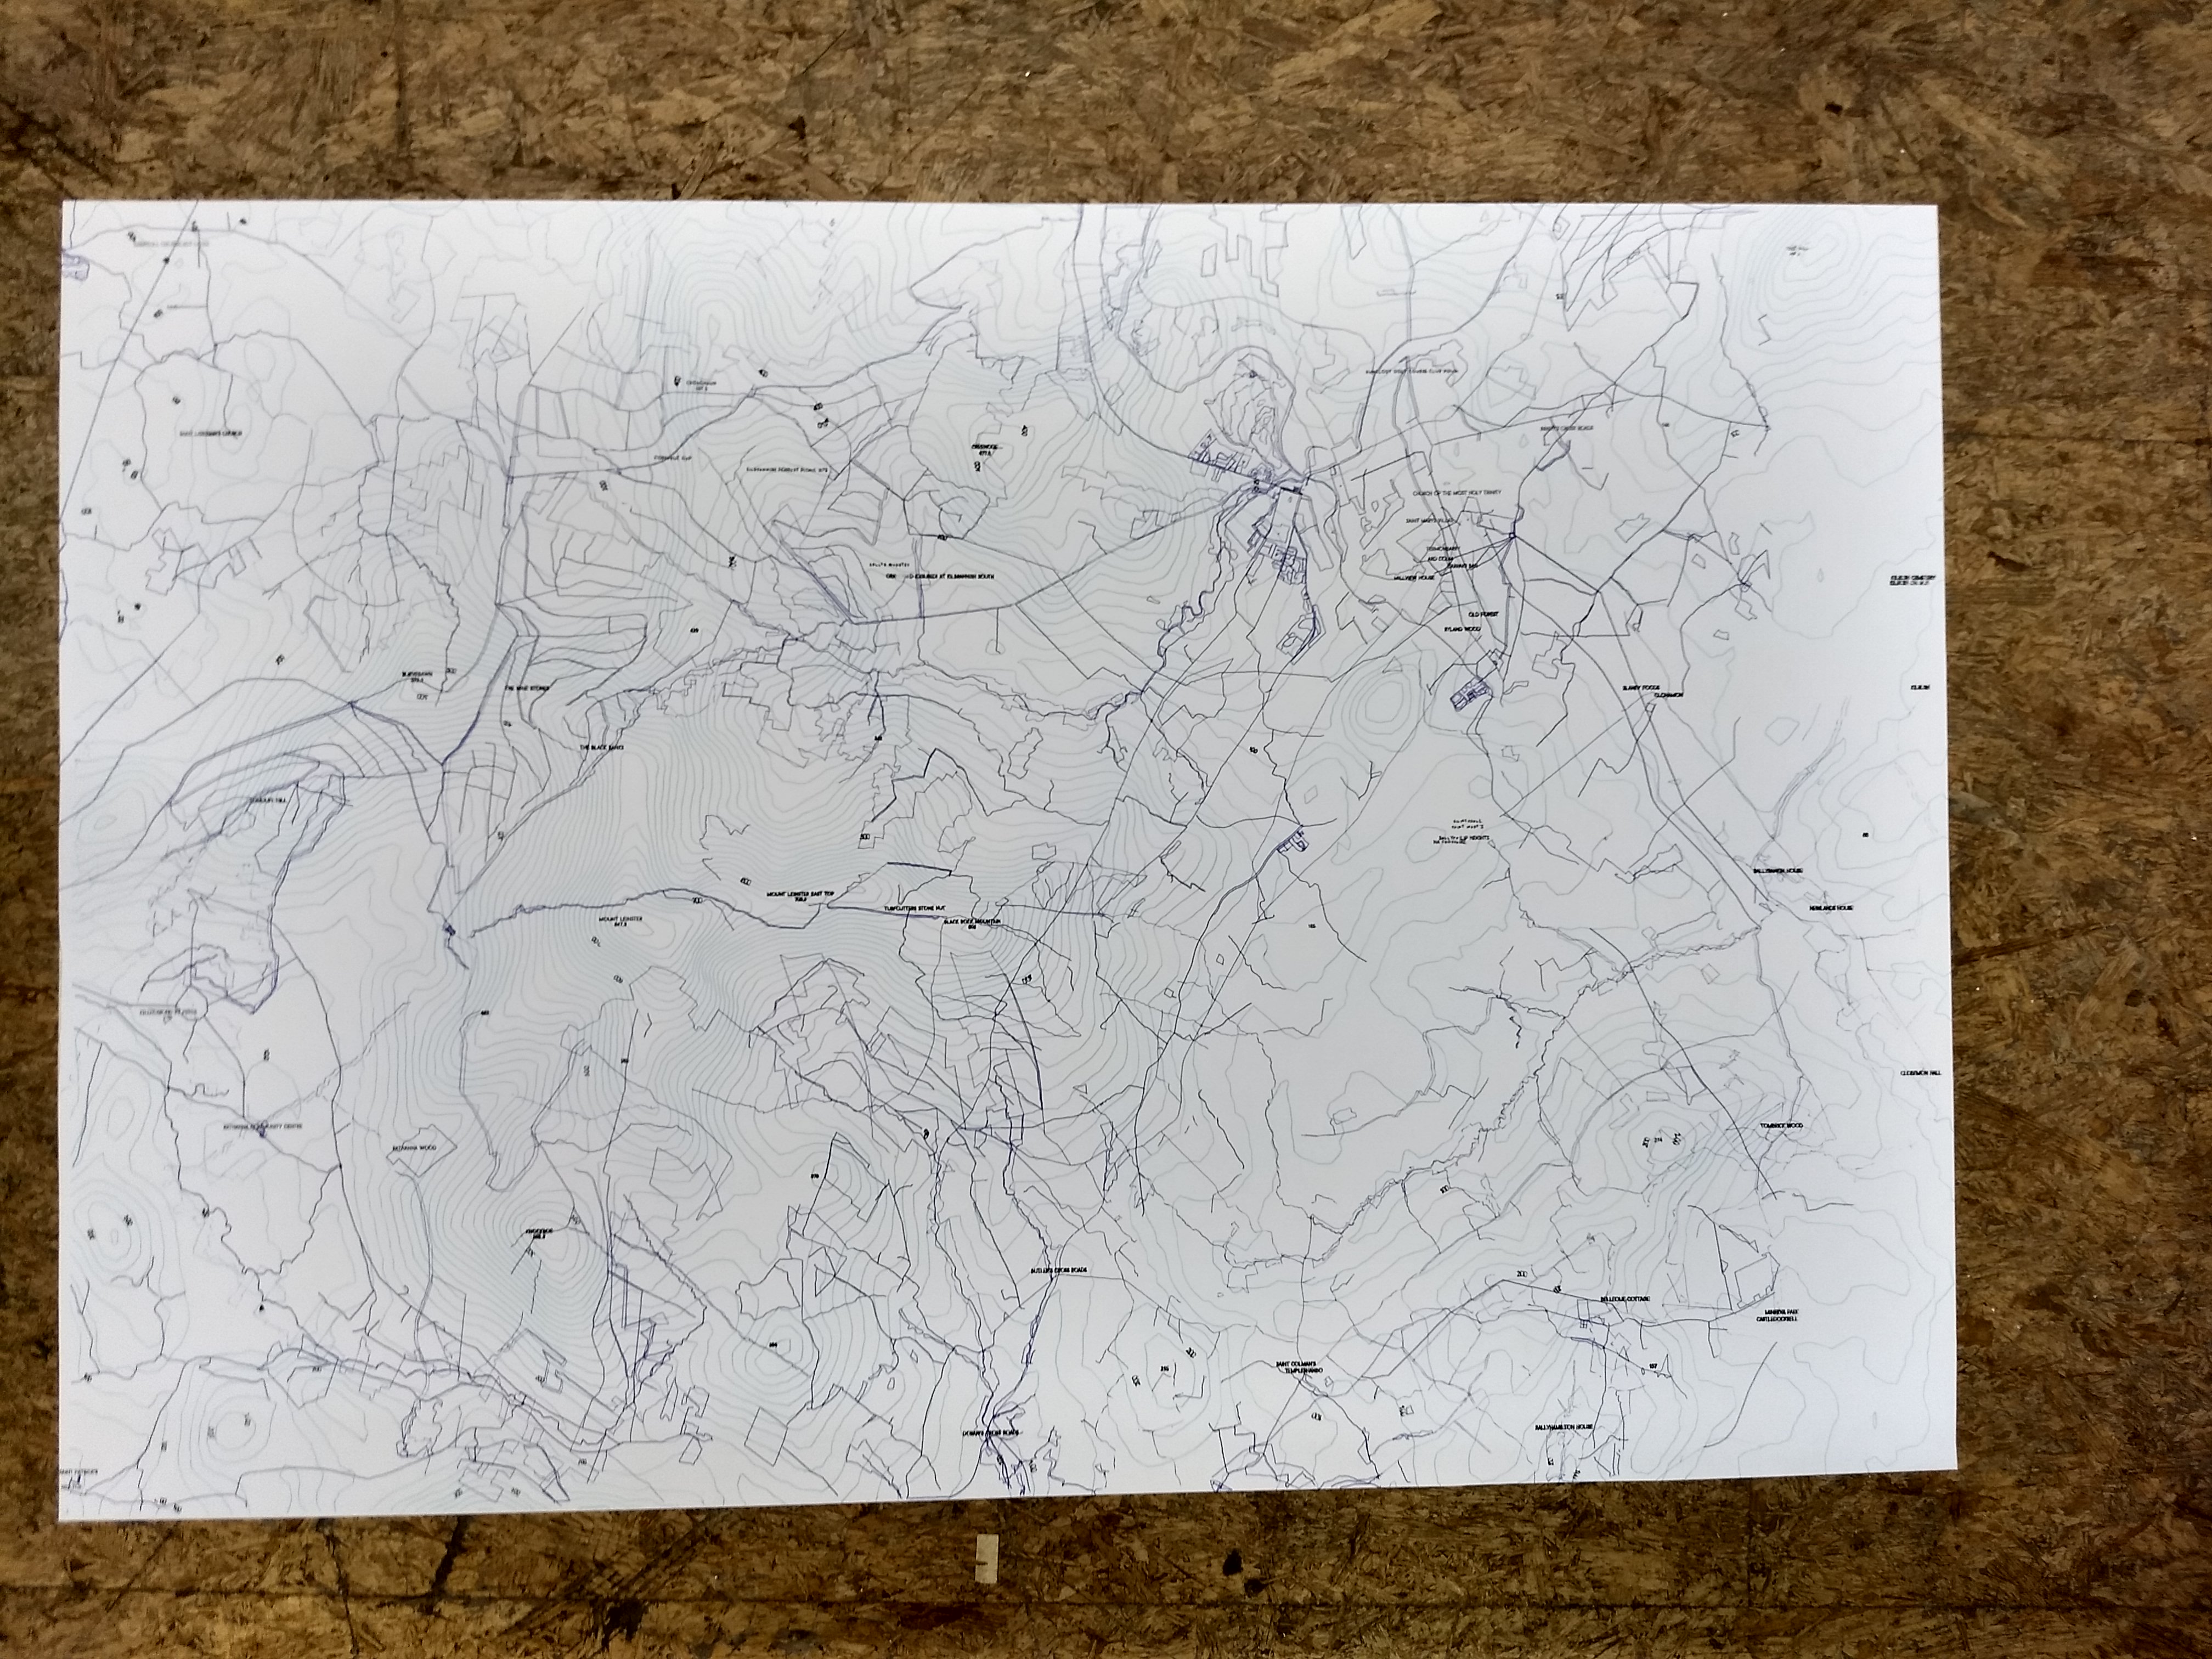
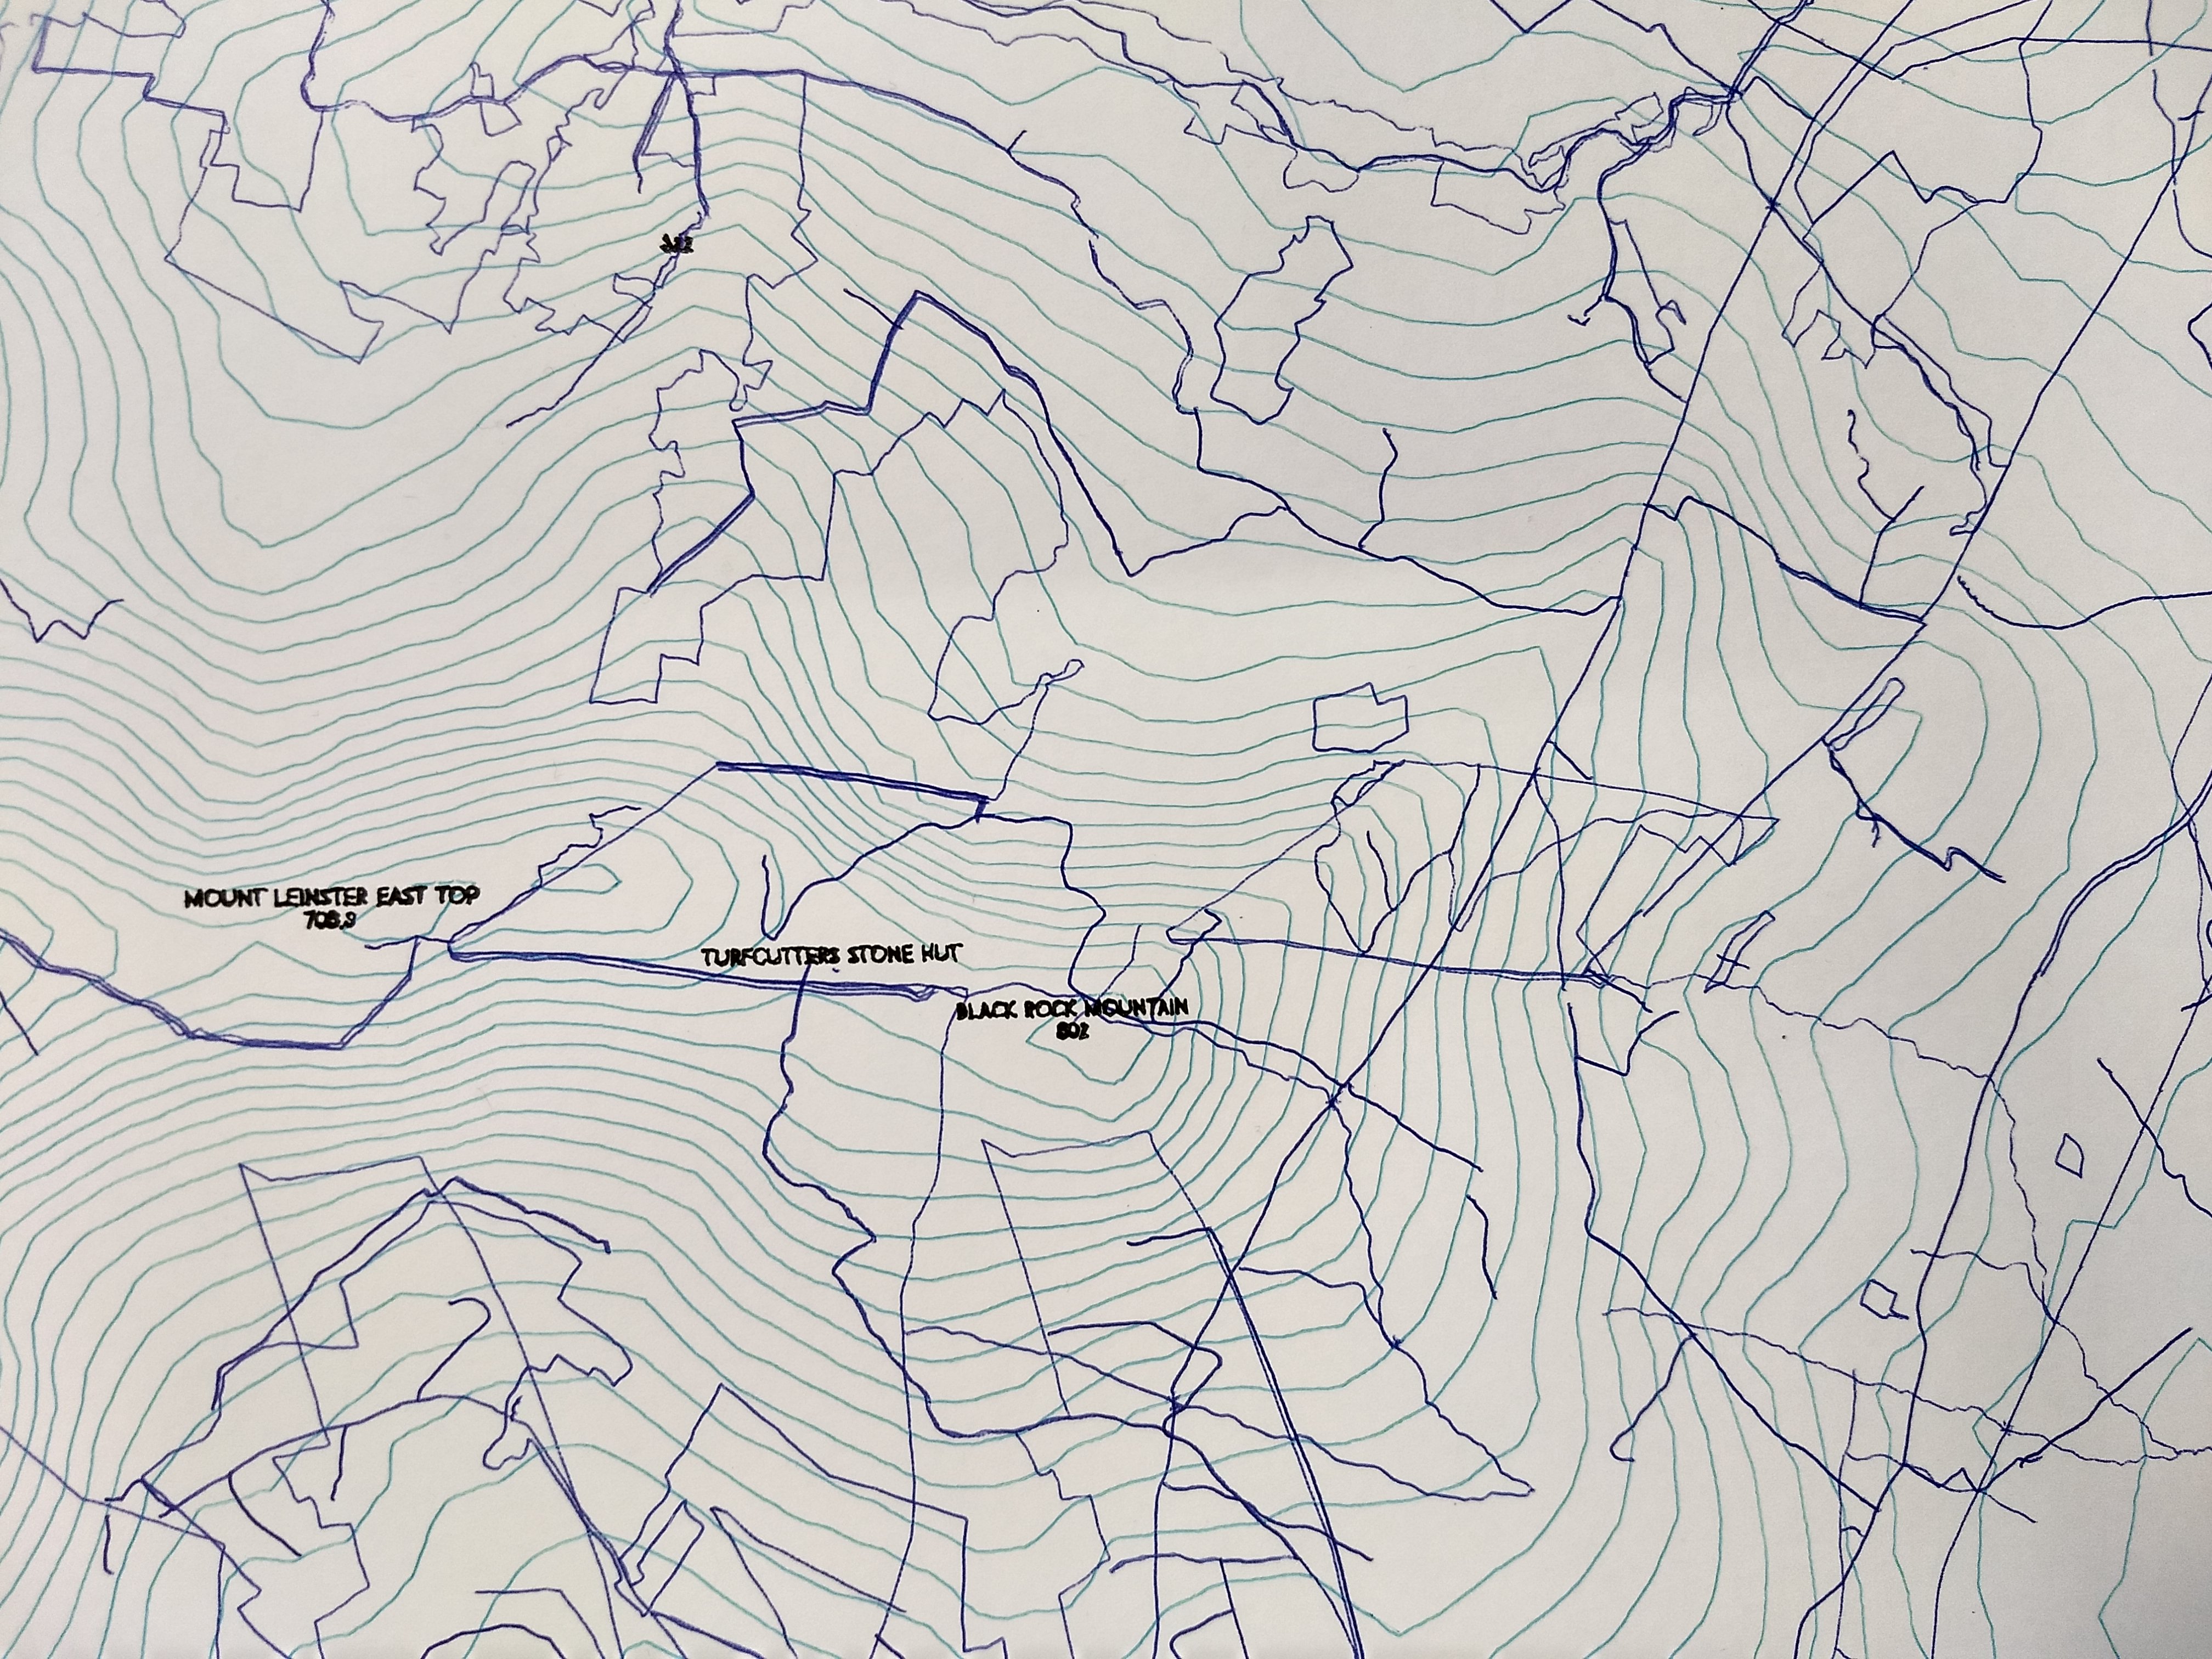
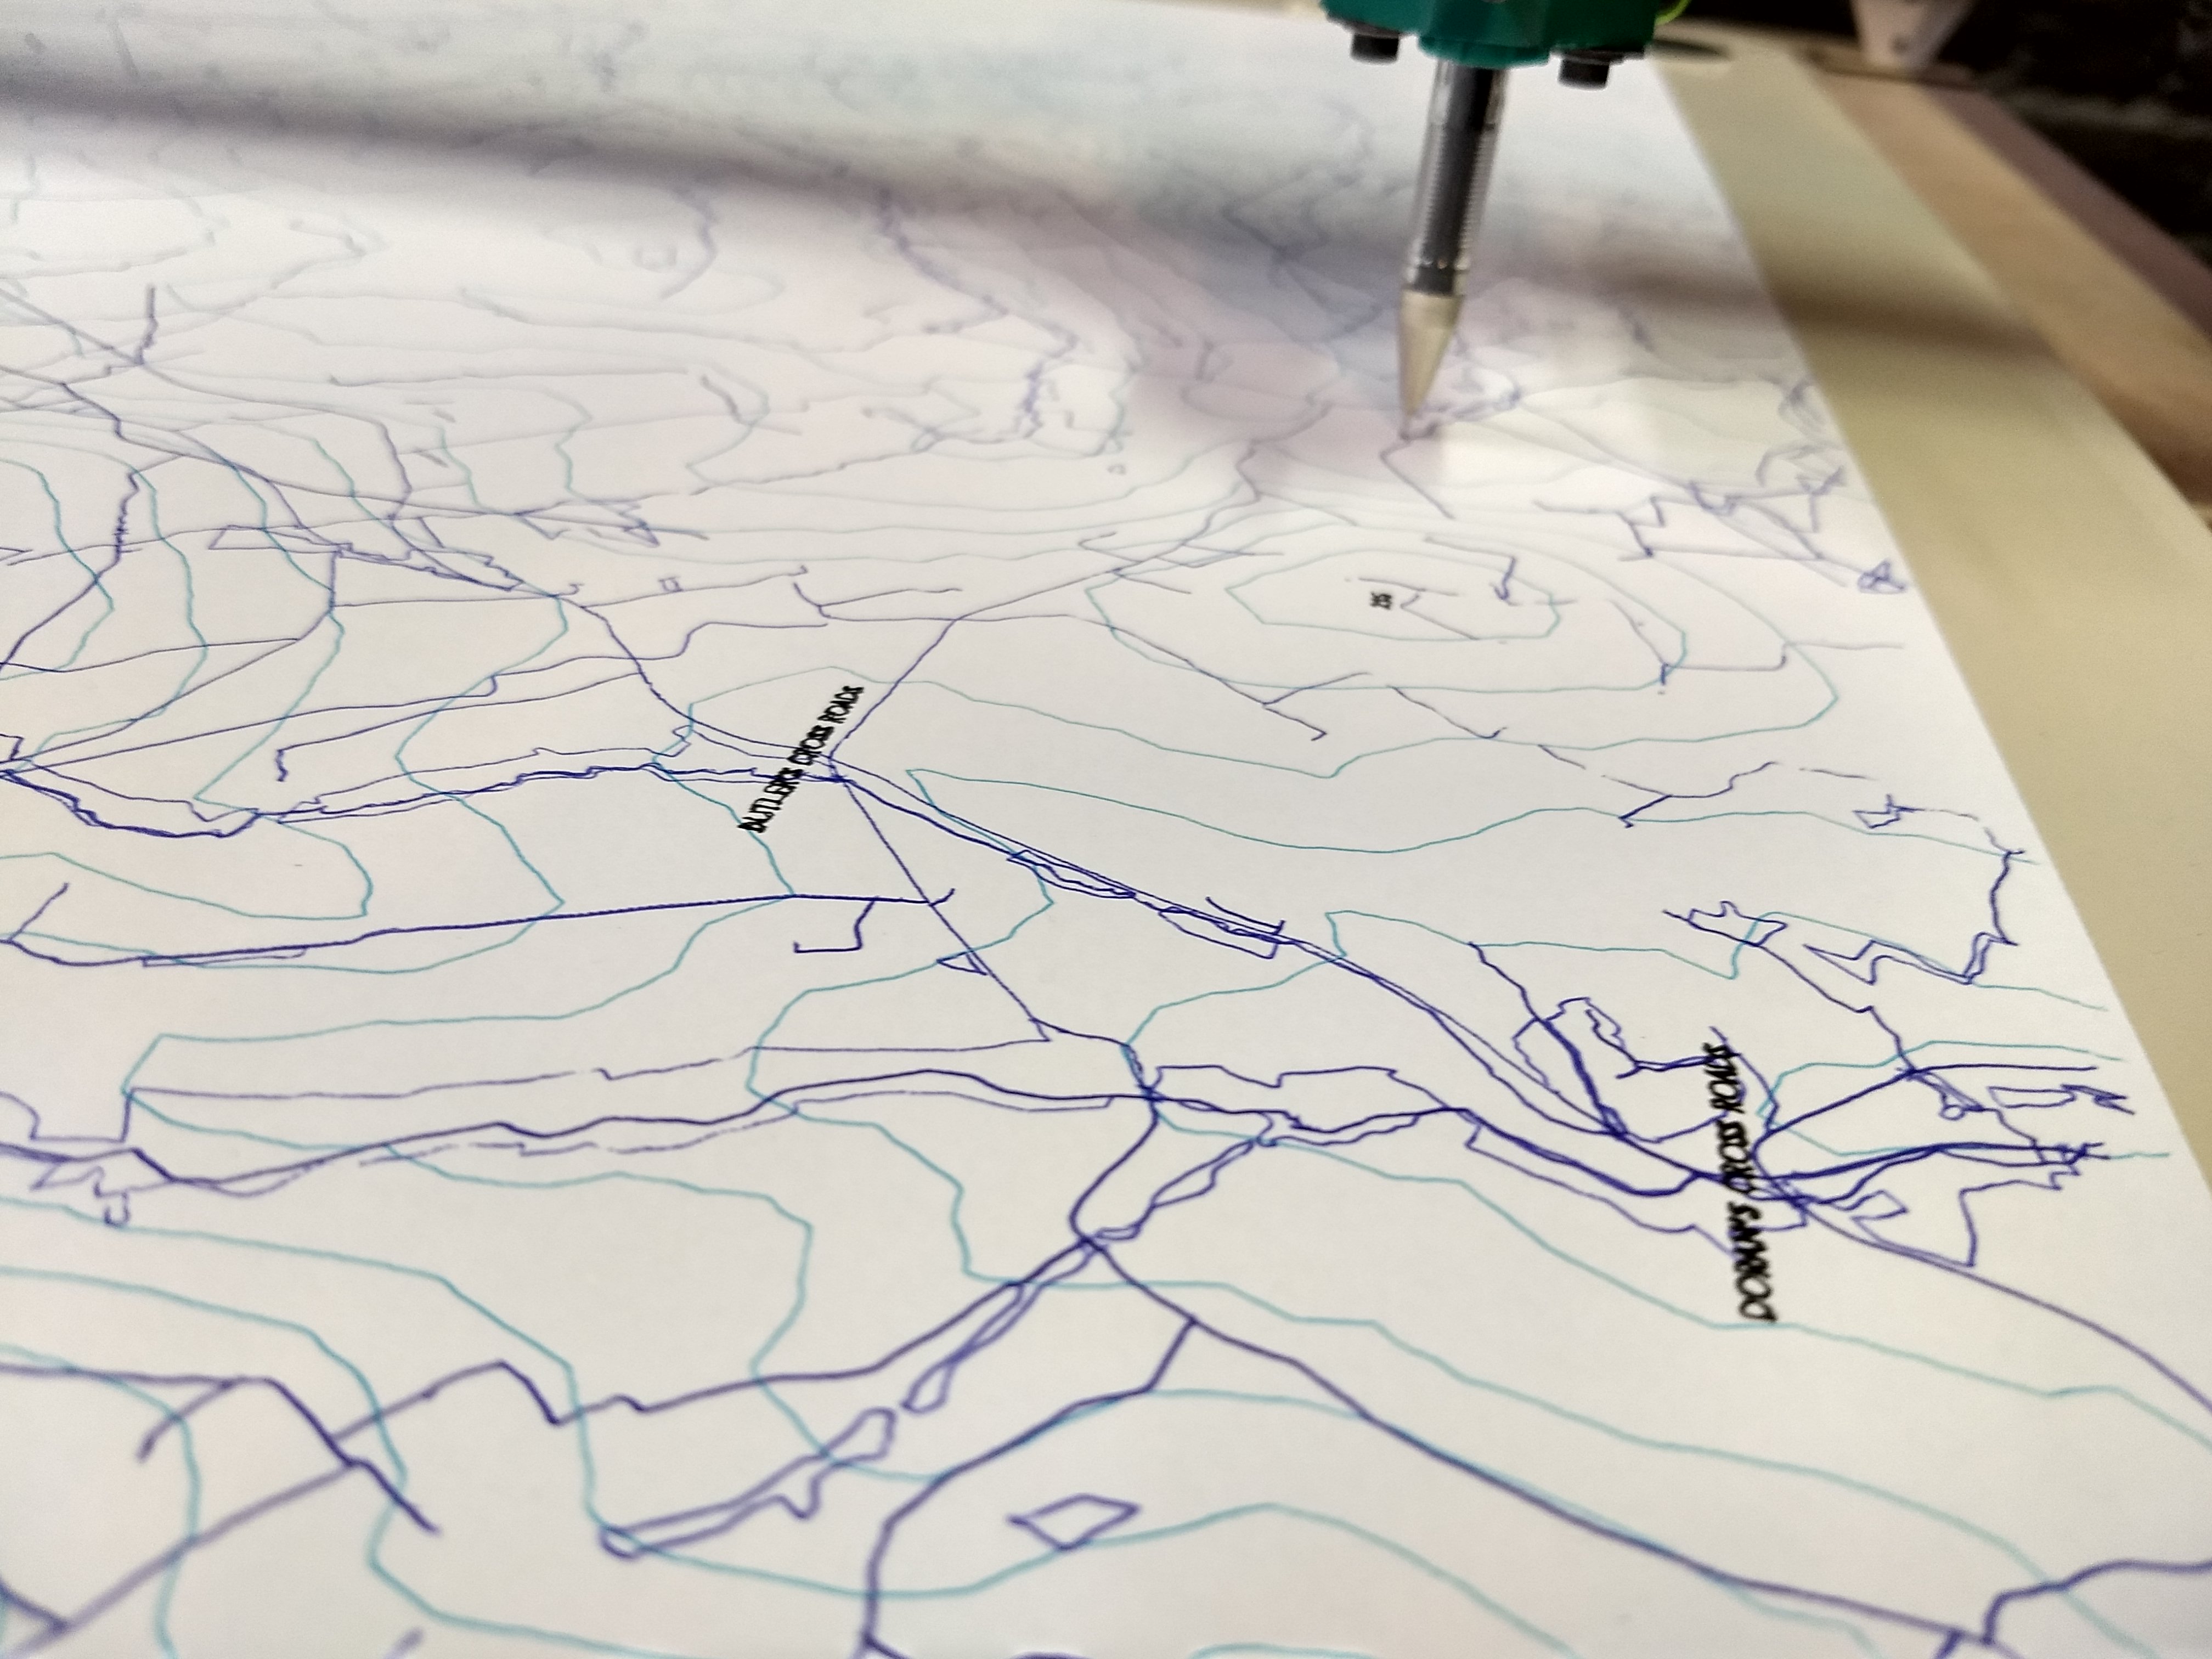
I've been meaning to document my OSM to SVG process for a while now, I just had to run the process again recently, so here was a new chance to take screenshots along the way. The basic idea is to process a portion of Open Street Map data into a vector paths and shapes. One of the ways I have been able to accomplish this is using an xml conversion tool, in my case, xsltproc but there are many others. Before we can convert the dot osm xml, here is how I obtain the osm data in the first place:
Note: this process is greatly aided by this page on the OSM wiki, but a lot of the info and links are out of date, hence this document. It remains a good place to start. [https://wiki.openstreetmap.org/wiki/Osmarender/Convert_osm_data_from_OSM_file_to_an_SVG_image]
Getting the data
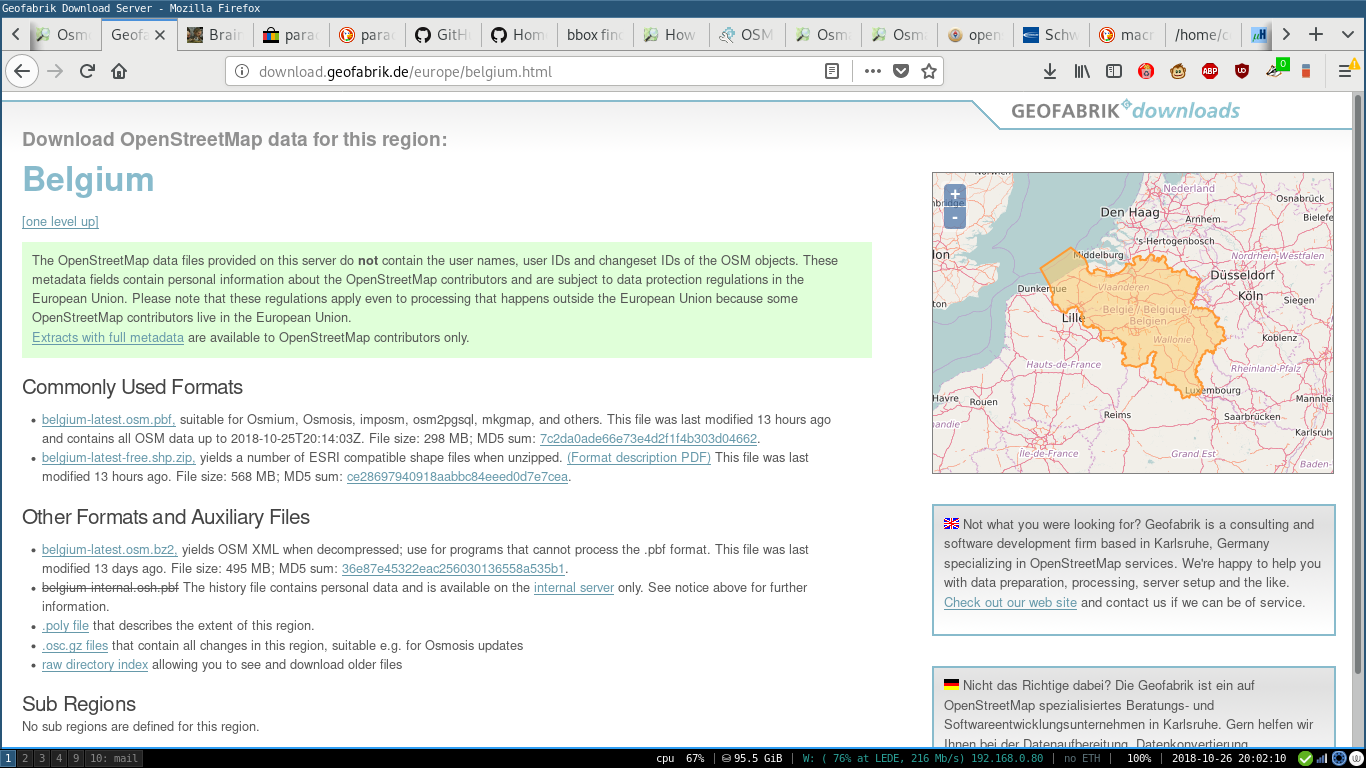
It is possible to extract bits of OSM using the API, making a GET request in this format https://api.openstreetmap.org/api/0.6/map?bbox=-0.5,51.3,-0.4,51.4 but if your request is too big, the OSM api will refuse to treat your request. Most of the time I simply download a full country file from geofabrik http://download.geofabrik.de/europe.html
about the bounding box
Just for reference, a selection area can in this case be called the bounding box. In my experience, most tools that function with OSM expect the bounding box to be set as left,bottom,right,top. Depending on the api or tool, those values will be differenly seperated, but that order seems to be consistent, thank goodness.
Mine was of these values:
-6.59 52.87 -6.21 53.23 meaning left=-6.59 bottom=52.87 right=-6.21 top=53.23
I know there probably are better ways to do this, but I still get my box coordinates from this online tool from geofabrik again: http://tools.geofabrik.de/calc/#type=geofabrik_standard&bbox=-6.588098,52.879038,-6.214317,53.220207&tab=1&proj=EPSG:4326&places=2
That tool only gives you the coordinates, now we need to cut out our selection from the large file downloaded earlier.
cut out the piece you need
osmosis is used to cut out section of the map for easier work using a command like this, assuming you want to work with the compressed file* :
bzcat downloaded.osm.bz2 | osmosis --read-xml enableDateParsing=no file=- --bounding-box top=49.5138 left=10.9351 bottom=49.3866 right=11.201 --write-xml file=- | bzip2 > extracted.osm.bz2
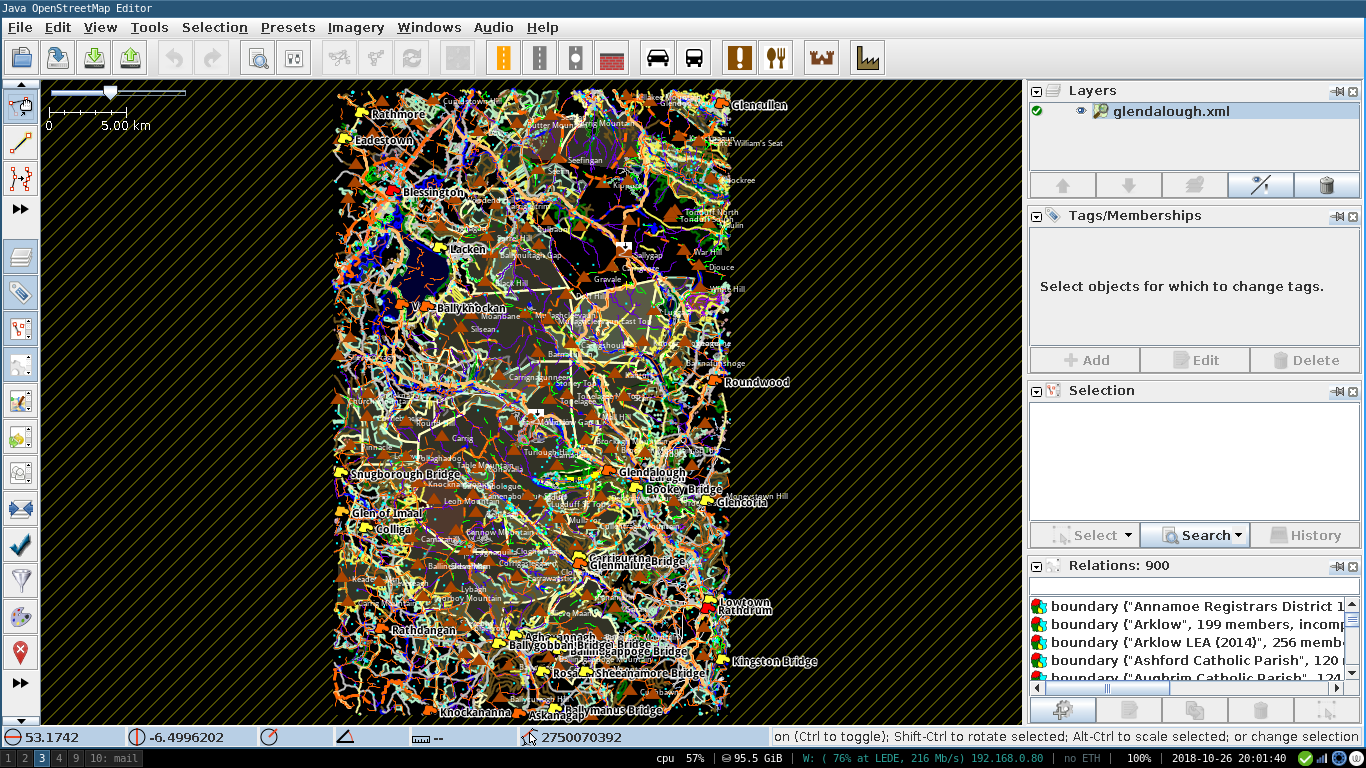
- you could also uncompress the file, and use the desktop Java OSM editing tool called JOSM. With JOSM, you can open and edit (it's main purpose) OSM data directly.
convert the OSM xml to svg using stylesheets from osmarender
Now comes the complex part of transforming OSM xml into SVG xml. See, OSM after all is basically one enormous xml database. This is an interesting but potentially problematic thing, long term. See emacsen's post about the serious troubles of OpenStreetMaps
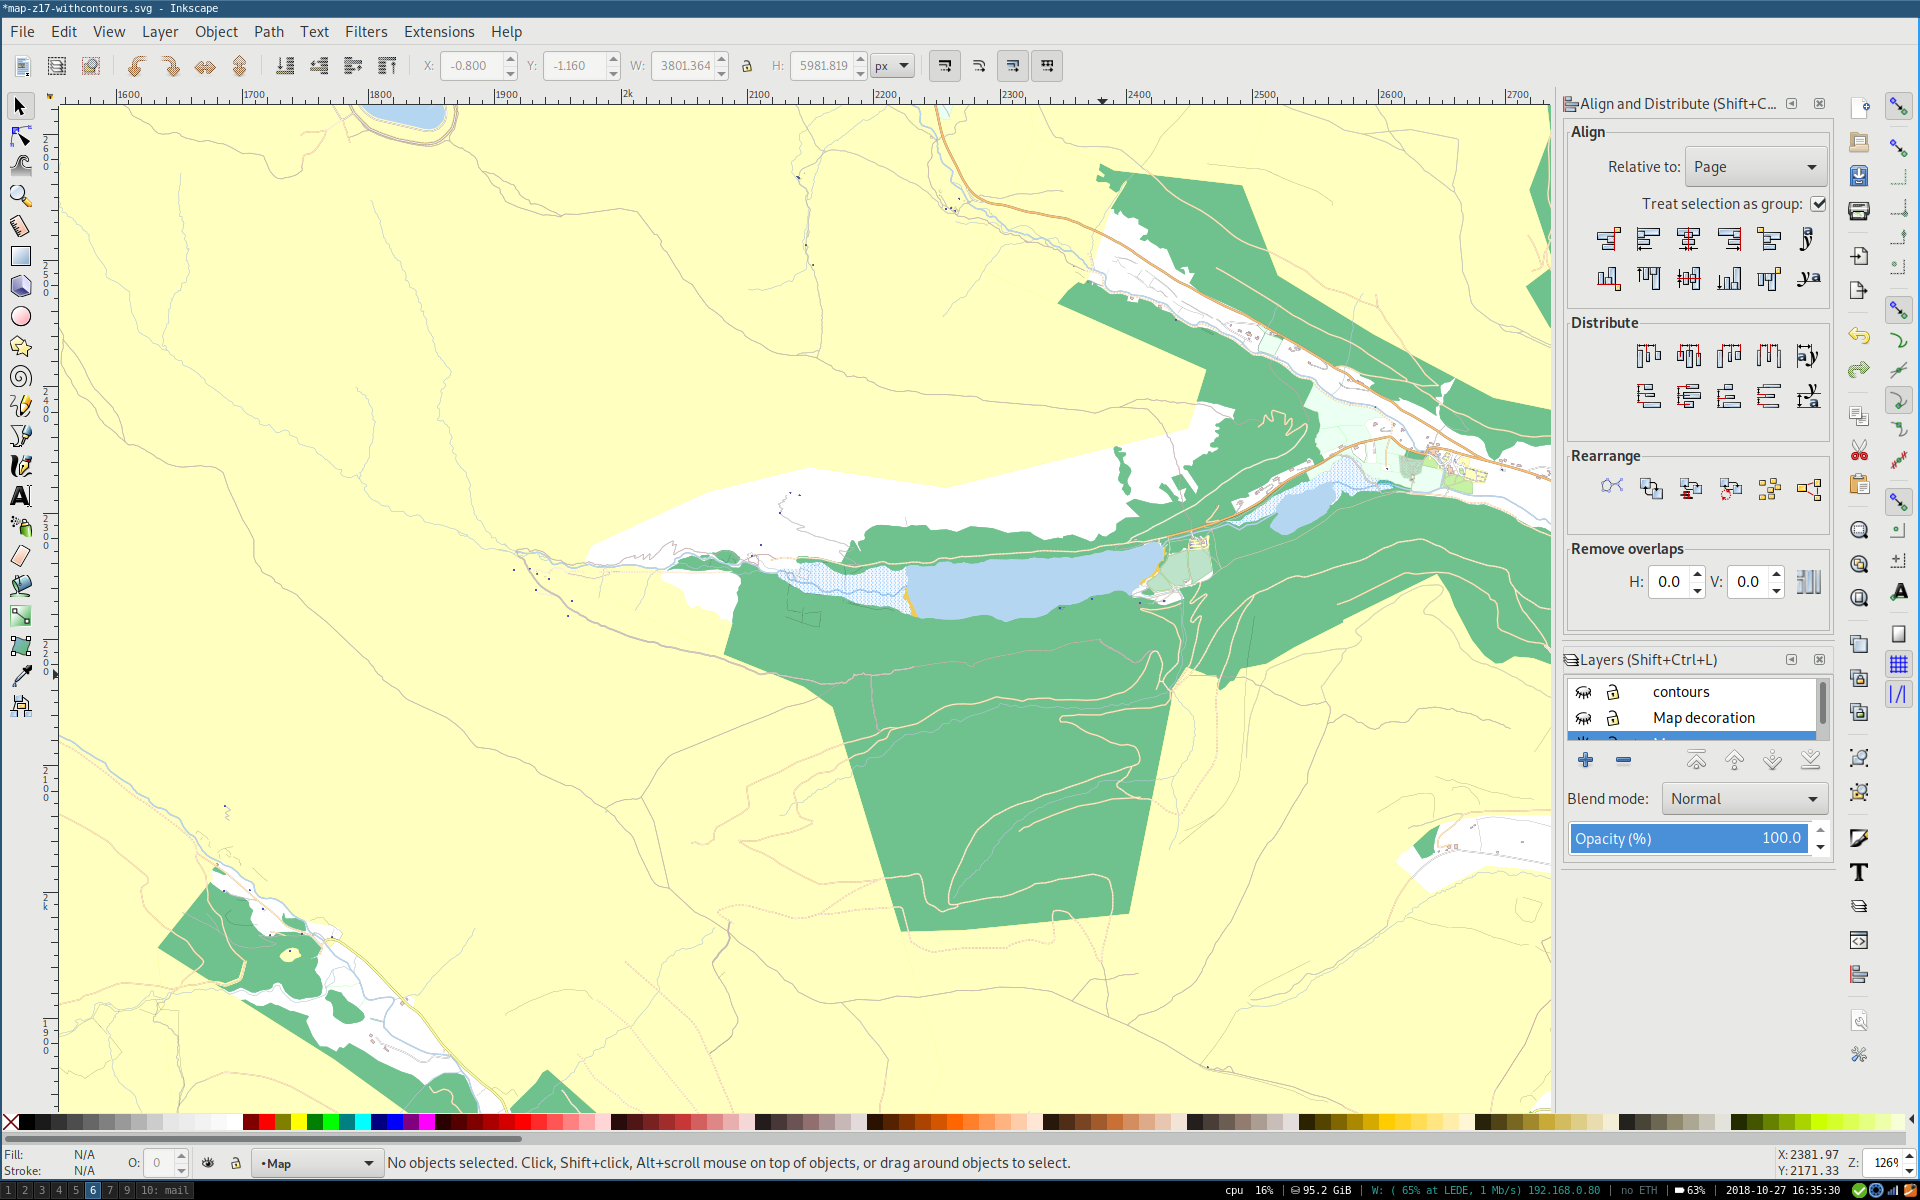
If you're reconciled with OSM for now, we need to convert the section of the map DB to svg, for which we need to rule-render the OSM xml to SVG xml. This is done using a stylesheet that can be obtained from osmarender.
OSMarender seems to have an xml processor built in but I couldn't get it to function on my system so I used *xsltproc* which reads rules from an xsl file + a stylesheet to convert all xml to all xml.
OSMarender gives us access to a load of zoom-level stylesheets. However when I tried to obtain these using my packet manager, all official links were dead, luckily, clones were made, so get yourself a copy of the OSMarender stylesheets from a place like this https://github.com/pnorman/osmarender-testclone
the xsltproc manual suggest this command structure as a general example: xsltproc -o map.svg osmarender.xsl osm-map-features-z17.xml but in my case, I use the xml fields to select a data file, so the command looks a bit more like this:
xsltproc -o bunclody/bunclody-fullmap.svg ../osmarender.xsl stylesheets/osm-map-features-z17.xml
!! Depending on the zoom level you choose, and the size of your bb, this operation can take multiple hours, be aware of this, and keep an eye on your system, the cpus will have pretty intense xml crunching to deal with !!
Note that this stylesheet includes a section of options in the file header that looks like this:
<rules
    xmlns:xlink="http://www.w3.org/1999/xlink"
    xmlns:svg="http://www.w3.org/2000/svg"
    data="/home/colm/git/osmosis/glendalough.osm"
    svgBaseProfile="full"
    scale="1"
    symbolScale="0.107"
    textAttenuation="14"
    minimumMapWidth="0.5"
    minimumMapHeight="0.5"
    withOSMLayers="yes"
    withUntaggedSegments="no"
    showScale="no"
    showGrid="no"
    showBorder="no"
    showLicense="no"
    interactive="no"
    showRelationRoute="no"
    symbolsDir="../stylesheets/symbols"
    meter2pixel="0.1375">
Contour lines
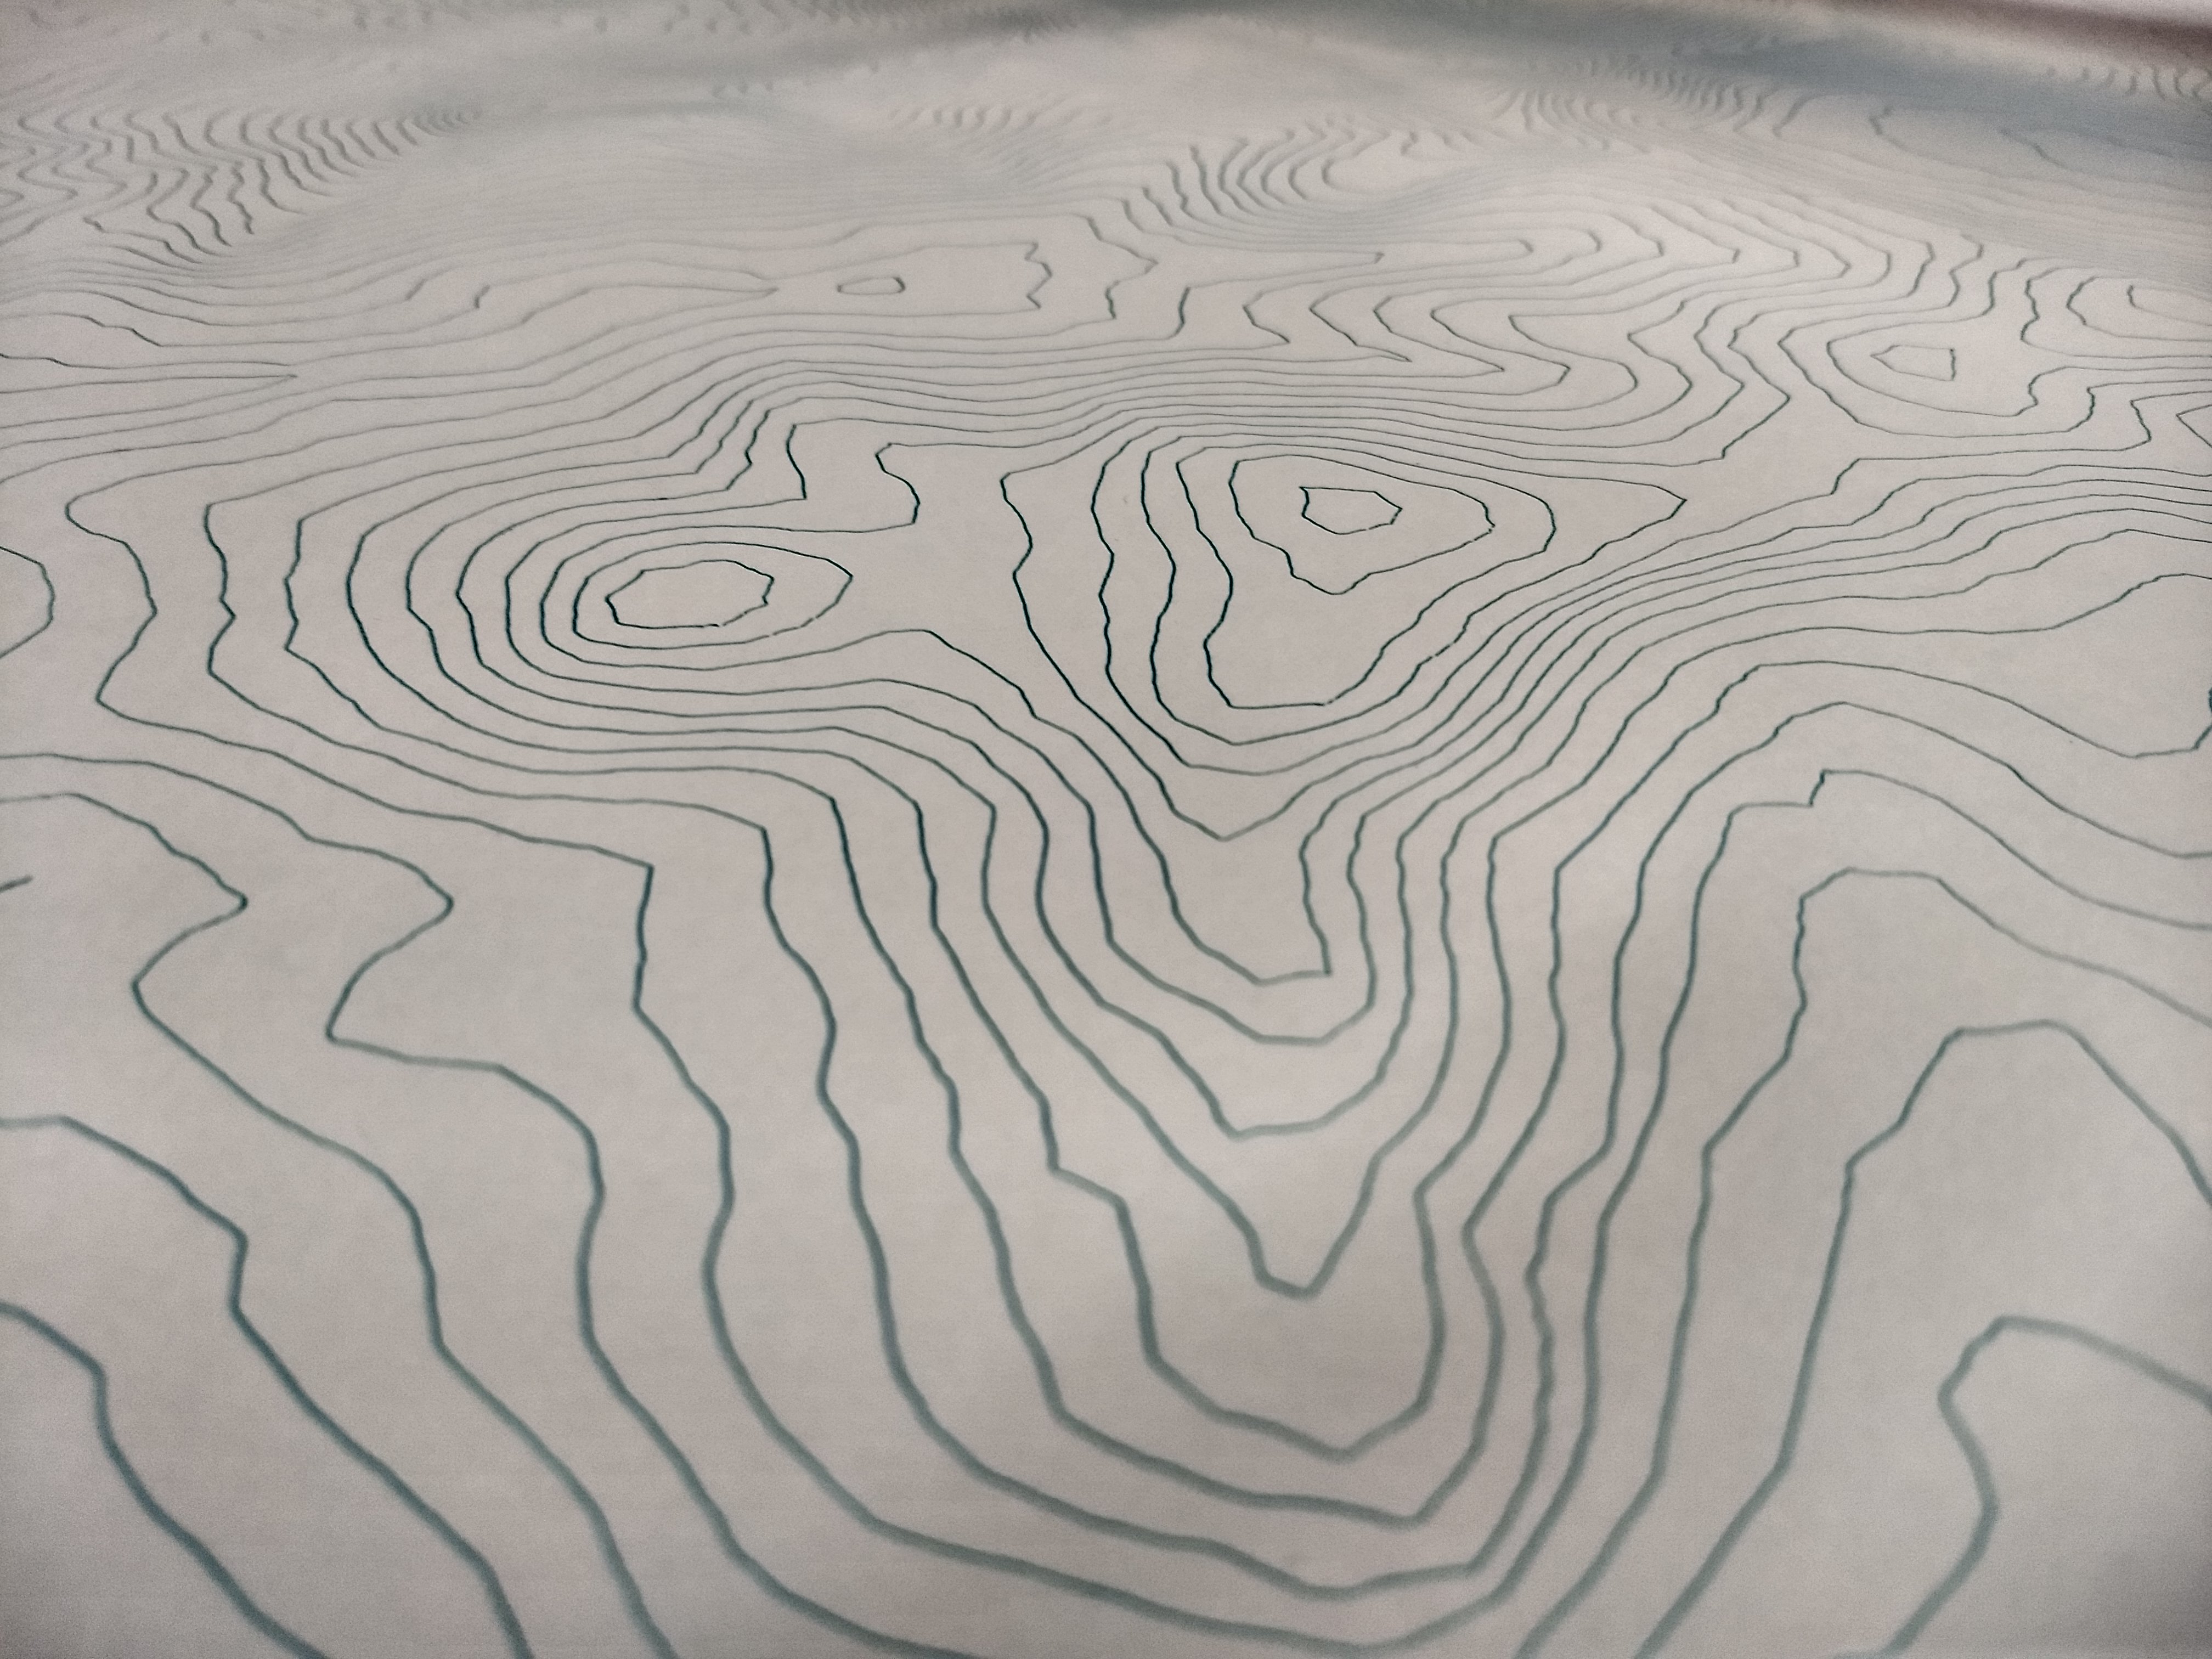
Unfortunately, the OSM db does not include any contour lines data. Thankfully, out bounding box can be a query element for earthexplorer using phyghtmap that will give us a .osm export of the bounding box we're interested in.
phyghtmap --earthexplorer-user=colm --earthexplorer-password=********** -a -6.59:52.87:-6.21:53.23
phyghtmap expects left:bottom:right:top as noted above
phyghtmap will need login credentials from earthexplorer, so you'll need an account from there before you can download any of that data. I'm unsure how phyghtmap queries earthexplorer exactly, but in my case, the bounding boxes I set often result in multiple files. To merge the two or more files that your phyghtmap query returns, I use JOSM, import both datasets as different layers and then merge them from the program. This is not exactly a necessary step, but as I'm bringing in the contour lines as a separate svg layers, when merged, the contour lines layer will be exactly the same size as the OSM data we converted earlier, meaning it can be easily aligned to the baselayer.
xsltproc -o bunclody/contours-wscale.svg osmarender.xsl bunclody/stylesheets/osm-contours-only.xml

Next, you need to convert this other OSM-type data into svg also, using a similar xsltproc command. Here this repo was essential again https://github.com/pnorman/osmarender-testclone
merging the two
Bringing together your different svg layers is done with inkscape of course and now you have multiple paths to chose to handle your data. If you're just doing on screen renders, then I believe this text will be enough for you. If you intent is flat printing, I can't help you there yet, as my interests have been around plotting these maps; for this read on.
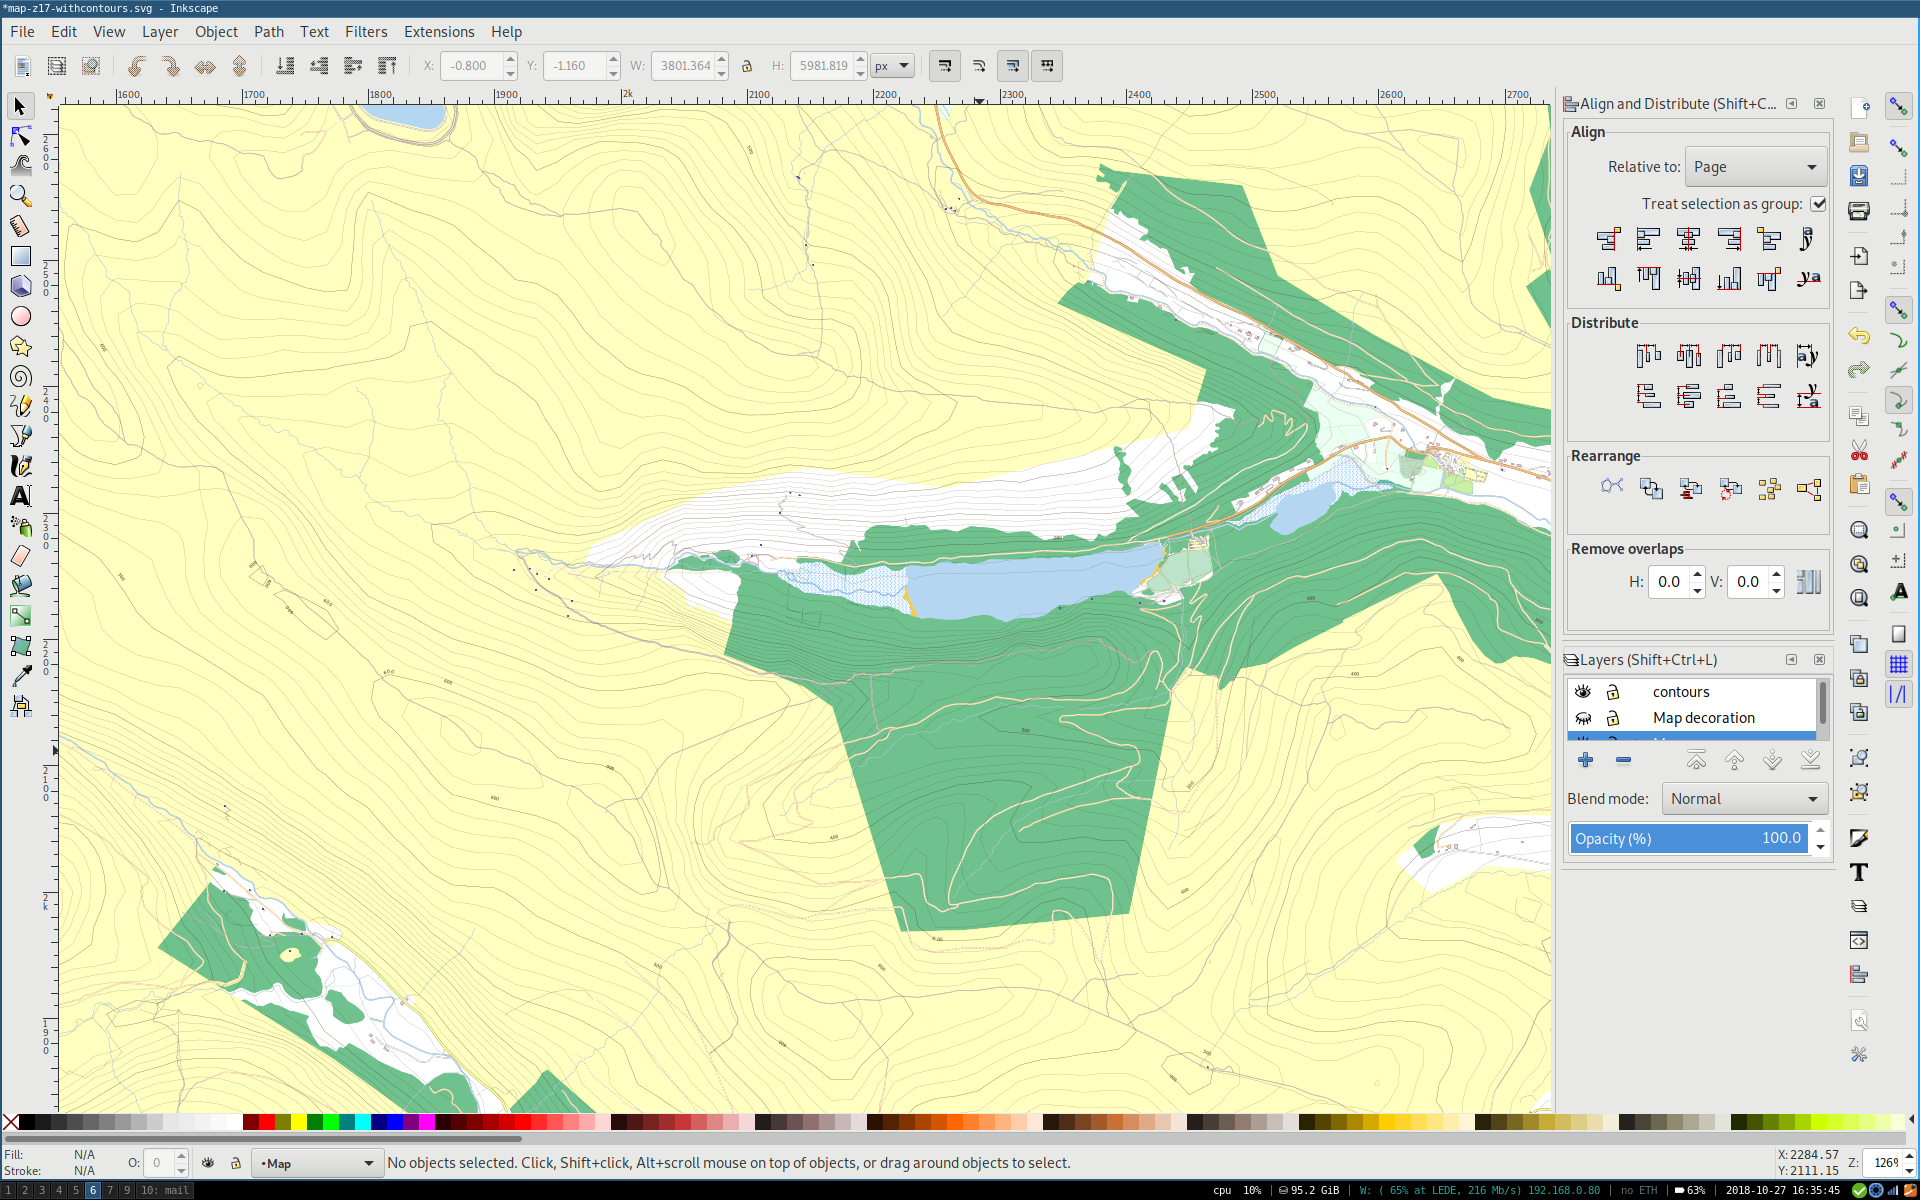
First of all, I had to (re)discover some inkscape tricks to help me work on the different parts of the maps. I listed some of these below, I may add to this list later:
-
resize svgs + content to different sizes https://graphicdesign.stackexchange.com/questions/6574/in-inkscape-resize-both-the-document-and-its-content-at-the-same-time
-
Find replace tool in inkscape: CTRL + f, open options, uncheck all types, select text or paths to create a dynamic selection that can then be moved to a separate layer.
-
osmarender follows SVG practices pretty nicely, but if you're tying to convert objects to paths, inkscape will complain about working cloned objects. The
-
I'm still looking for a way to save one single inkscape layer as it's own SVG, any ideas on this topic are appreciated.
Later, I process the SVGs either to HPGL or to GCODE. If your machine uses the latter, I suggest using the ! now built in ! gcodetools extension. If gcode in inkscape is your path, I personally got to grips with the extension with this published method: https://www.norwegiancreations.com/2015/08/an-intro-to-g-code-and-how-to-generate-it-using-inkscape/
Happy mapping !
